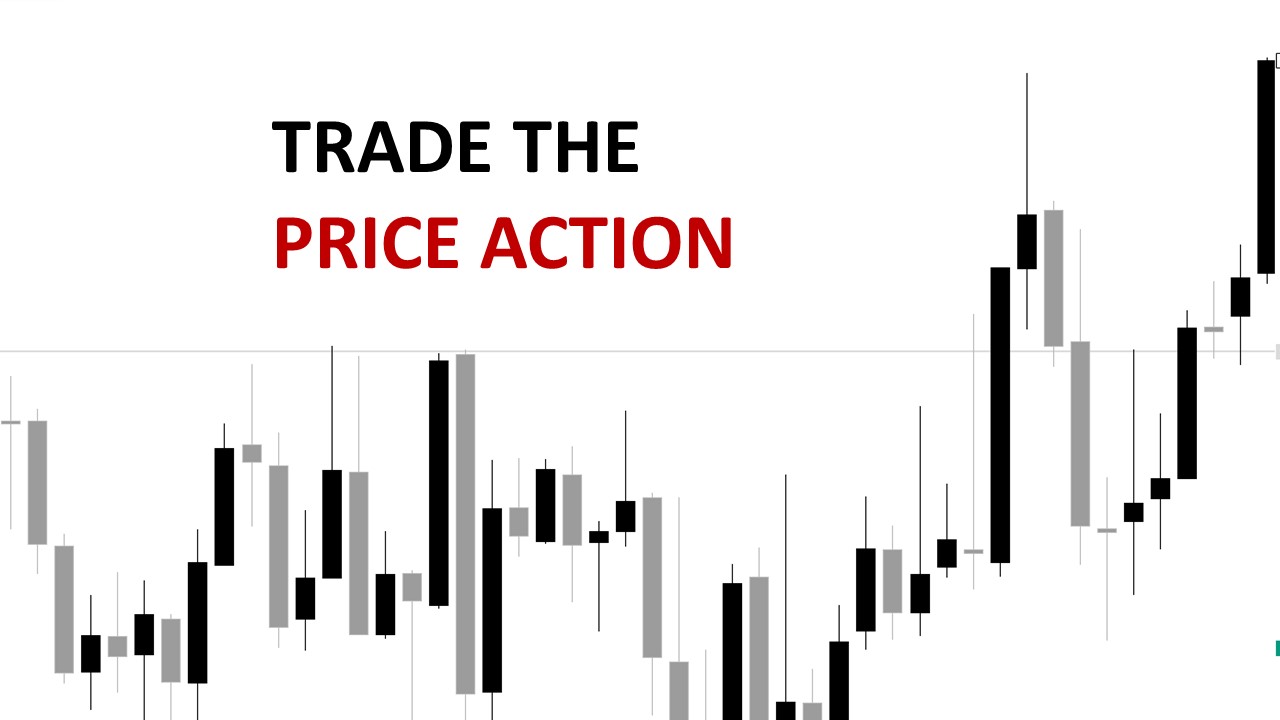
Whenever you open a chart with RSI, MACD, Stochastics, and ten moving averages, you feel confused, hesitant, and unable to enter. But do you know the truth? Prices aren’t predicted by indicators – they just react to them.
There is one thing that professional traders, hedge funds, and proprietary desks rely on above all: the raw price chart to trade the price action. As the price moves, they see where liquidity is building, where orders are stacked, and where momentum is shifting. When you learn to trade the price action, confusion disappears.
A 2024 report by FXStreet reported that 68% of professional traders rely heavily on “price behavior at key levels” when making decisions, compared with just 19% who rely solely on indicators.
These insights confirm why top traders prefer to trade the price action instead of chasing indicators.
Therefore, before adding another indicator, take a moment to pause. Taking a look at what the market is actually saying will help you learn what to look for and how to trade the price action profitably. With practice, you’ll begin to see how professionals consistently trade the price action across different pairs and timeframes. If you want consistency, learn to trade the price action — not the noise.
Propxem’s Tip:
Propxem’s Copy trading system follows the same principle. Trades are executed automatically on connected accounts based on price behavior across multiple pairs, allowing traders to observe real-time execution and learn without surrendering their capital to fund managers.
Key Takeaways
- Indicators respond after the move, whereas those who trade the price action see the move as it develops.
- In order to detect liquidities and momentum zones, institutional traders use price behavior.
- In Propxem’s copy-trading models, execution is based on structured, price-based models.
Table of Contents
What Price Action Really Is?
A price action trade isn’t just about trading without indicators — it’s about learning to trade the price action through real buyer-seller behavior.
Examples of key signals:
- Long lower wick → buyers stepped in strongly.
- Long upper wick → sellers controlled the session briefly.
- Engulfing candle → potential momentum shift.
As a result of price action, traders can anticipate moves rather than react to them after they have occurred.
It is not lagging indicators that are used by big players, such as banks or hedge funds, but price movements, order flows, and liquidity patterns. Even beginners can observe these patterns and make consistent trades.
Babypips believes candlestick patterns and price movement analysis are foundational tools for understanding Forex markets.
Key Takeaways
- Trading based on real-time behavior means you trade the price action directly.
- Buyers and sellers are represented by candlestick formations.
- The ability to observe patterns helps traders anticipate moves before they occur.
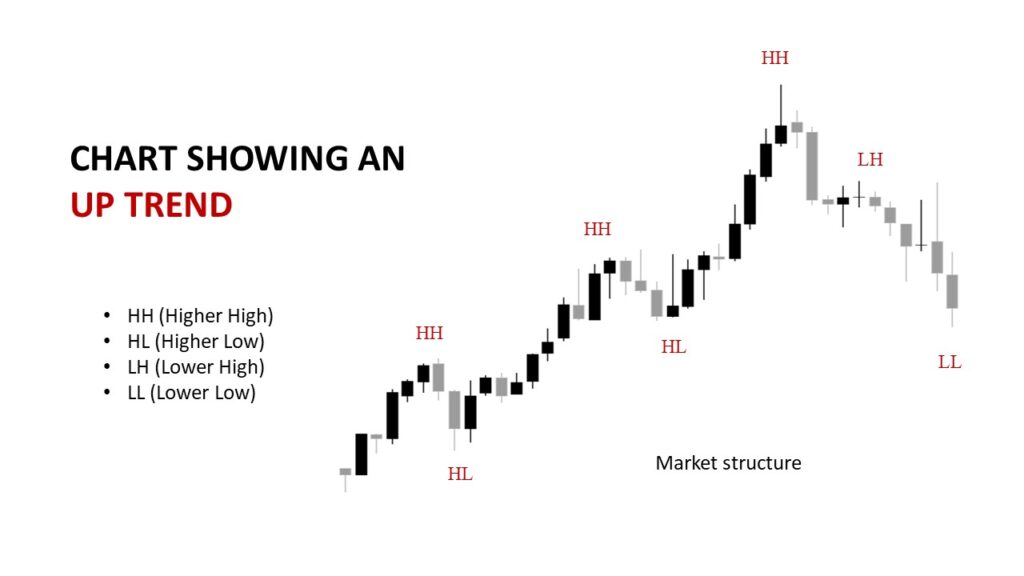
Market Structure — The Backbone of Trading the Price Action
To trade the price action, you must understand the market structure first. An understanding of market structure is essential to understanding price movement. Consider whether the market is trending, ranging, or reversing before committing to a trade.
- Uptrend: higher highs (HH) and higher lows (HL)
- Downtrend: lower highs (LH) and lower lows (LL)
- Range: horizontal swings with no clear trend
The ability to recognize these patterns enables traders to anticipate entry zones and avoid false signals.
Example: Consider the scenario where EUR/USD forms three consecutive higher highs: 1.070, 1.080, and 1.090. As soon as price drops below the previous higher low at 1.080, the structure shifts into the bearish zone. Traders who trade the price action spot these shifts earlier.
According to a DailyFX report, traders using market-structure-based analysis performed more consistently than those using indicator crossovers alone.
Key Takeaways:
- Understanding structure helps anticipate momentum shifts.
- Breaks of structure often indicate trend reversals.
- Market structure maps the flow — learn to trade the price action with it.
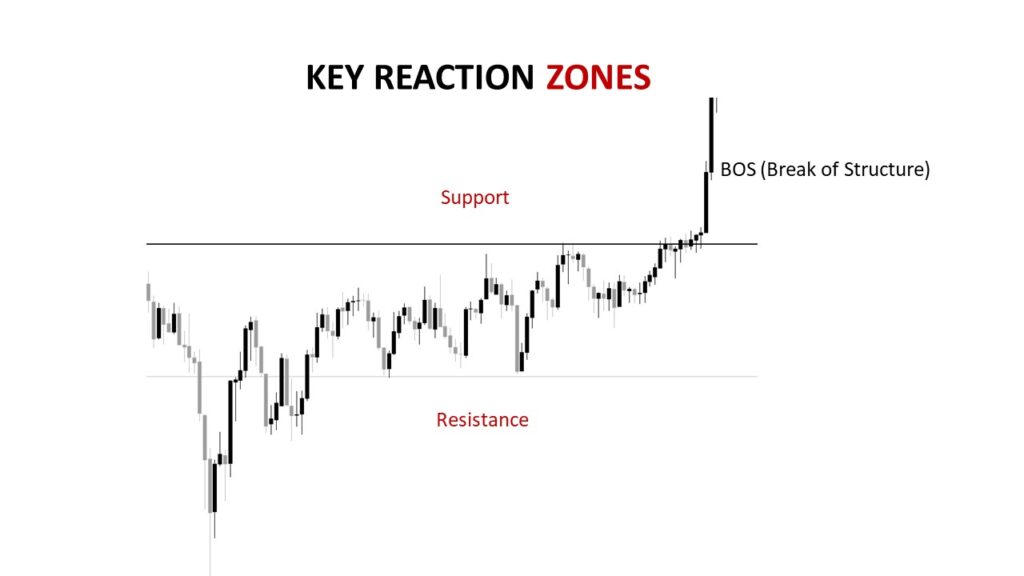
Support and Resistance — Key Reaction Zones
When you trade the price action, support and resistance are your GPS. S&R (Support and Resistance) refers to decision zones where buyers and sellers react. In order to plan trades, they are areas where institutions have previously entered or exited.
How to Identify Reliable Levels:
- Swing highs and lows — major turning points on higher timeframes.
- Zones tested multiple times — the more price touches, the stronger the level.
- Reclaimed levels — broken resistance becomes support, broken support becomes resistance.
Example: Consider a scenario in which USD/JPY repeatedly tests 152.00 and fails to break higher three times in a month. Later, the price returns to the same level. Watching this zone helps those who trade the price action spot real momentum. Smart traders use these zones to trade the price action directly, instead of waiting for delayed indicator signals.
| Types | Definition | Reliability |
| Horizontal Level | Clear swing high/low on daily chart | ★★★★★ |
| Supply & Demand Zone | Price areas with repeated reactions | ★★★★☆ |
| Dynamic Level | Trendline or moving average confluence | ★★★☆☆ |
According to Investopedia, support and resistance are among the most widely used tools since they highlight key price decisions.
Key Takeaways:
- S&R zones are where liquidity and market decisions concentrate.
- Levels with multiple tests are more reliable.
- Price respects decision zones — so always trade the price action, not the indicator.
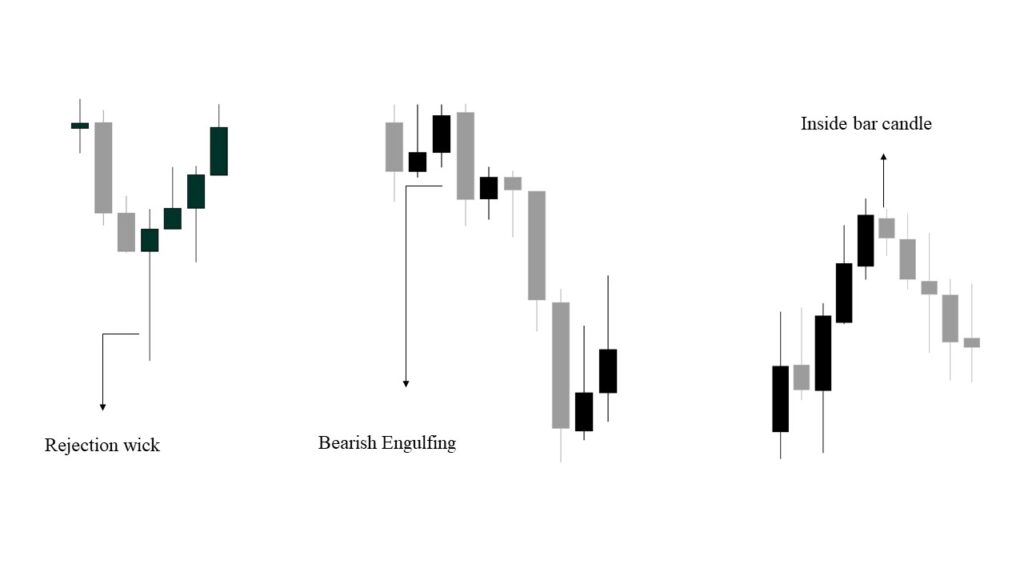
Reading Candles Like Conversations
When you trade the price action, every candle is a sentence in a longer market story. While indicators translate that story into numbers, candlesticks show you when traders hesitated, defended, or surrendered.
The Language of Wicks and Bodies
The longer the wick, the greater the rejection; the larger the body, the greater the conviction. Not the pattern name, but who won the battle inside that candle is the key to understanding the pattern.
1. The Rejection Candle (Pin Bar Evolution)
After a U.S. inflation report, EUR/USD dropped sharply to 1.0620. In contrast to continuing lower, buyers suddenly defend that level; the next candle leaves a deep tail and closes near its open.
That single rejection tells you:
Smart money just absorbed selling pressure here.
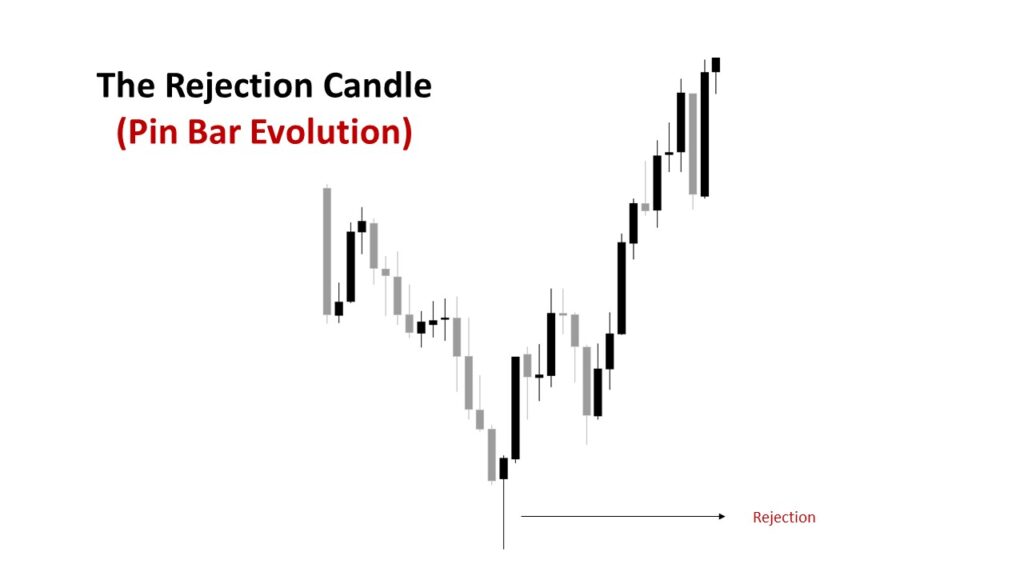
How to trade it:
Wait for price to retest the rejection zone, and only then look for continuation entries – no guessing, just confirmation. Smart traders trade the price action here by waiting for confirmation.
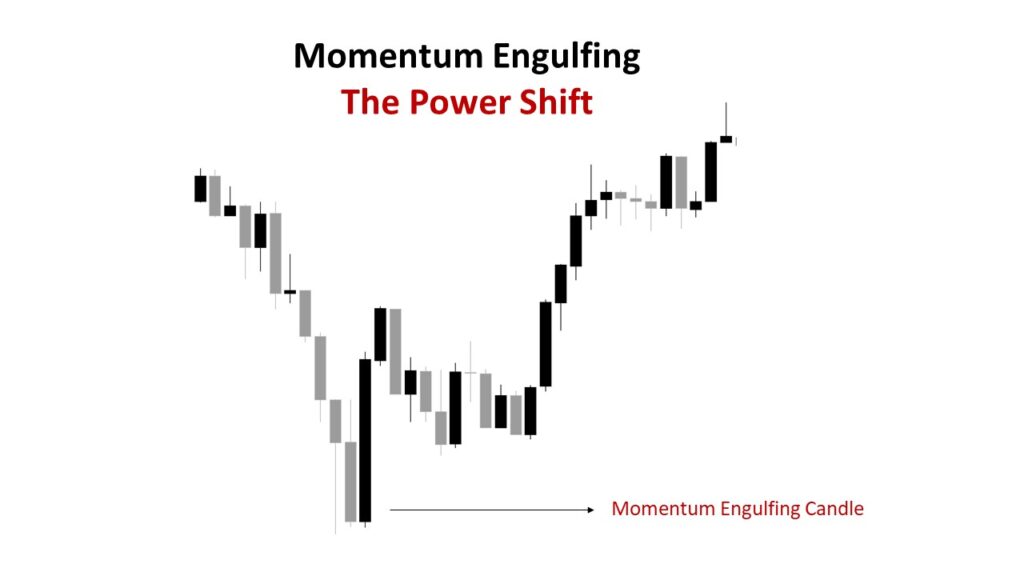
2. Momentum Engulfing — The Power Shift
It is very rare to see a bullish engulfing candle after a week of decline. This indicates a change in liquidity, with sellers exiting and buyers entering aggressively.
Scenario: After falling for three sessions, the GBP/JPY chart shows a wide green bar that swallows the previous two candles. Volume spikes.
That’s not luck — that’s institutional repositioning.
3. Inside Bars as Pressure Cookers
Bars inside aren’t pauses; they’re compression zones.
Think of them as the spring before release. It is the release of stored energy when a price breaks out of a range after several attempts to do so.
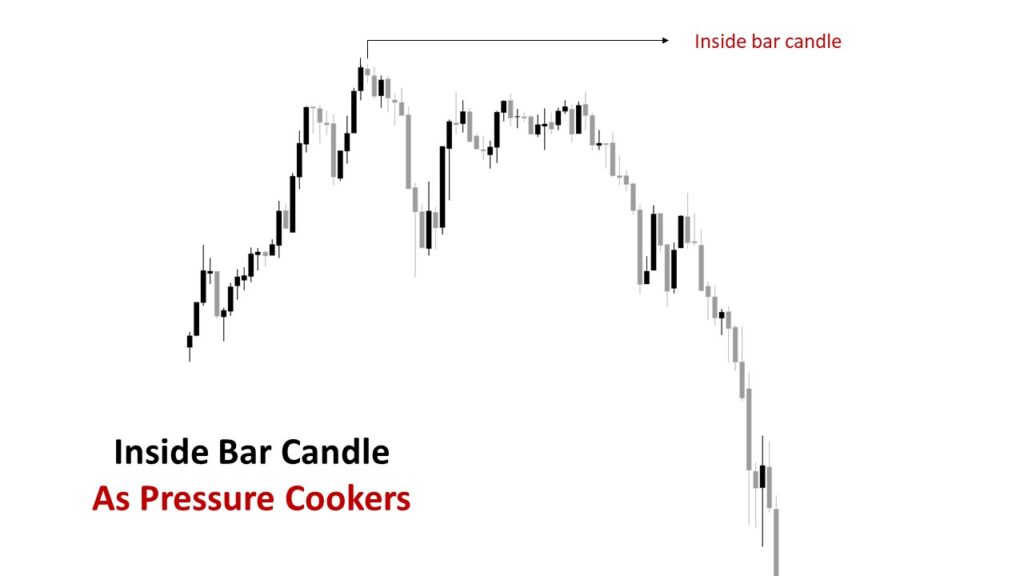
Pro insight: Many prop desk traders (including us at Propxem) treat candle formations as context tools rather than entry triggers. The structure, time of day, and liquidity of the market confirm the storylines.
Key Takeaways:
- Focus on meaning, not pattern names.
- Rejection + structure = probability.
- Candles confirm where liquidity entered or exited.
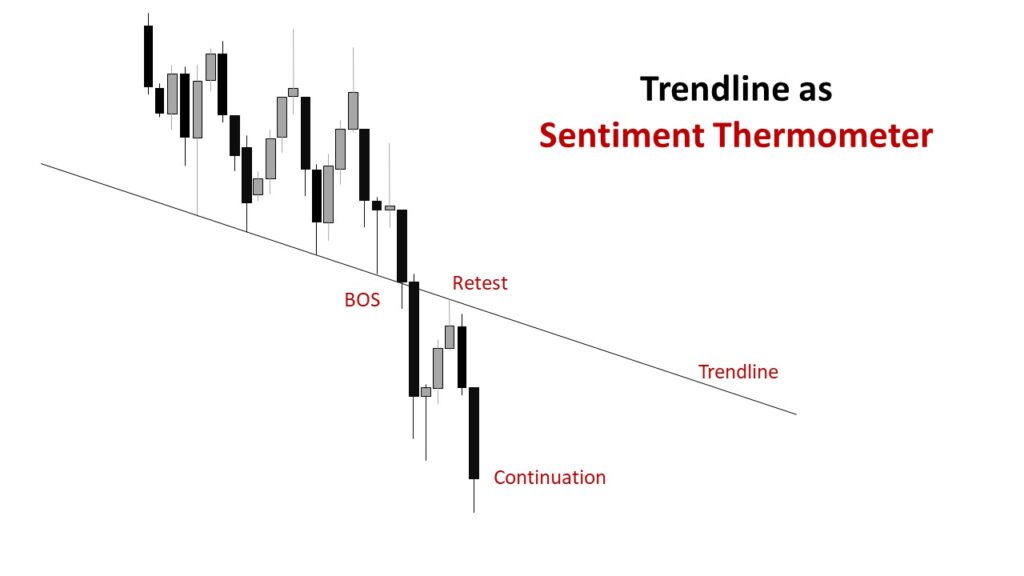
Trendlines as Sentiment Thermometers
When you trade the price action, trendlines reflect belief, not geometry. The trendlines show how aggressively participants agree on a direction.
A break in sentiment indicates that sentiment has cooled; a retest indicates that sentiment has been reevaluated.
Drawing with Discipline:
- Anchor lines on obvious swing highs/lows.
- Use higher timeframes (H4/D1) for bias.
- Avoid “forcing” lines through wicks to justify a bias — the market doesn’t care about your ruler.
Scenario: The Silent Shift
A ten-day upward trend has been observed in AUD/USD. Draw a trendline under the higher lows.
Price breaks below it on heavy volume one London session, pauses, and climbs back to retest.
At the trendline, a small bearish rejection candle appears.
It’s not a coincidence – it’s a retest trap. The seller regains control.
Due to its ability to measure real trader behavior, this observation often outperforms five indicators combined.
Key Takeaways:
- Trendlines map belief, not geometry.
- The retest is the true entry point.
- Combine volume with structure to trade the price action precisely.
The 3-Phase Price Action Blueprint
This 3-step framework shows you how professionals trade the price action logically. This model simplifies how traders can effectively trade the price action without overcomplicating their charts. Let’s combine candlesticks, trendlines, and structure into a repeatable process.
Focus on logical cause-and-effect rather than “perfect setups.”.
Phase 1: Identify Market Structure
Ask: “Who’s in control?”
Higher highs/lows = buyers; lower highs/lows = sellers; sideways = indecision.
Mark obvious liquidity pools — areas where price reversed multiple times.
Phase 2: Wait for Emotional Clarity
A strong candle at a known level usually indicates an emotional imbalance, such as panic or greed. Don’t react to that imbalance when you see it. Keep an eye on whether the price respects or rejects the area.
Phase 3: Execute With Logic
- When structure, level, and candle align — that’s when you trade the price action.
- Use stop losses beyond structure, not random pips.
- Target the next liquidity area, not arbitrary profit goals.
Example Blueprint Trade
- Pair: EUR/USD
- Bias: Uptrend on H4
- Setup: Price pulls to 1.0750 support → bullish engulfing candle + break of minor trendline
- Entry: Break of candle high
- Stop: Below swing low (1.0720)
- Target: 1.0830 (previous resistance)
- Risk/Reward: 1 : 2.7
On historical EUR/USD data (2018–2023), setups meeting all three conditions consistently produced positive expectancy across 120 samples – not magic, just structure and discipline.
Propxem Insight:
Traders who follow our live price-action signals in Propxem Copy Trading often note that patience before entry — not entry timing — defines profitability.
Key Takeaways
- Build every setup around structure → reaction → confirmation.
- Protect capital first; profits follow repetition.
- Track data and keep refining how you trade the price action each week.
Why Price Action Outperforms Indicators?
Prices are compressed into formulas by indicators; price action expands them into understanding by price action.
When clutter is stripped away, intent becomes apparent.
It is for this reason that experienced institutional traders state, “Indicators lag; prices lead.”
The Psychological Edge
A trader who trades raw price develops an eye for detecting fear and greed.
Recognizing hesitation candles or fakeouts involves reading the crowd, not math.
Traders who trade the price action develop emotional control faster.
The Practical Edge
It is common for indicators to double-count the same information (e.g., RSI and MACD both derive from moving averages).
By reducing noise, price action provides a picture of where liquidity sits, rather than just how fast the price moved. That’s why experienced traders always prefer to trade the price action when identifying real market intent.
Example Comparison:
Two traders analyze USD/JPY:
- Trader A uses five indicators, sees mixed signals, and stays confused.
- Trader B marks a clear support zone and notices two rejection candles followed by higher highs.
Trader B enters long — same data, cleaner lens.
In 100 simulated trades, Trader B’s expectancy is higher not because of luck, but because price action eliminates lags.
By stripping away clutter, those who trade the price action gain cleaner insight.
Why It Fits Propxem’s Philosophy?
At Propxem, we trade the price action with human precision not using indicators.
This is a precision conversion of price action
Key Takeaways
- Price action equals data + psychology + discipline.
- It adapts to any market condition.
- Mastering how to trade the price action builds trader intuition faster than indicator chasing.
Why Price Action Wins?
| Factor | Indicators | Price Action |
| Lag | High | Low |
| Adaptability | Limited | High |
| Context | Numerical | Psychological |
| Learning Curve | Shallow | Deep but lasting |
Want to see real traders apply these principles live?
Join Propxem Copy Trading — where every trade follows structured, price-driven logic while you keep full control of your funds.
The Psychology Behind Price Action Mastery
To trade the price action profitably, you must read your emotions clearly. Trading the Price action isn’t just about candlesticks and lines; it’s about human behavior.
Each chart movement represents thousands of tiny emotional decisions – fear, greed, hope, hesitation – repeated over and over again.
To trade the price action profitably, you must learn to read your own emotions as clearly as you read a chart.
1. The Illusion of Complexity
The majority of traders begin their journey by chasing complicated systems because they feel safe in complexity.
Complexity hides indecision, however.
The trader who uses ten indicators sees ten opinions.
Price-action traders see one truth: the crowd’s emotion is reflected in price.
“The more layers between yourself and price, the less you comprehend the truth.”
It’s for this reason that institutional traders often strip down their screens to naked charts – clarity equates to confidence.
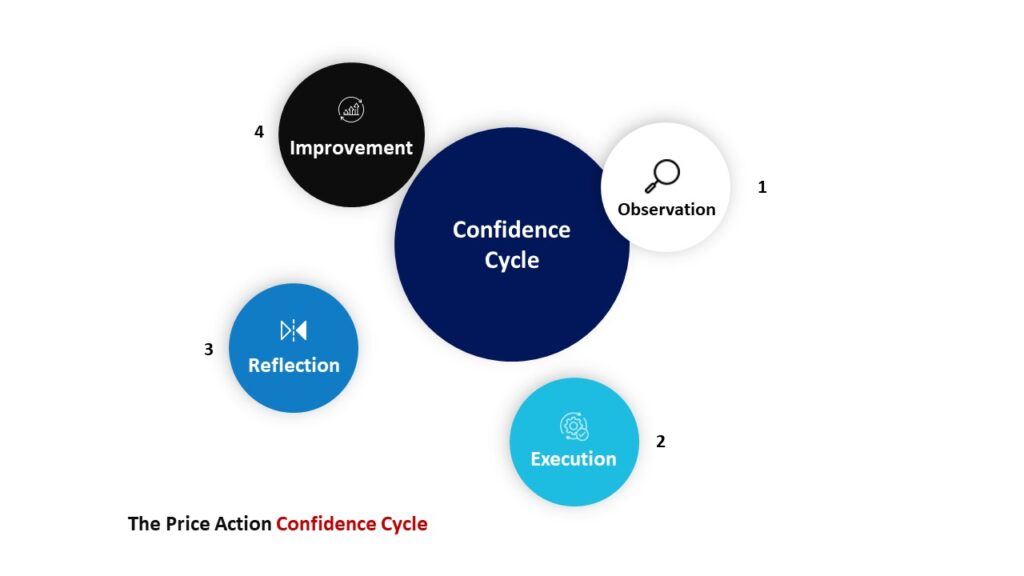
2. The Confidence Cycle
Consistency in trading isn’t born from luck or leverage — it’s born from a repeated pattern of observation → execution → reflection.
Here’s how the Confidence Cycle works for a price-action trader:
| Stage | Description | Outcome |
| Observation | You analyze price structure, reactions, and zones. | Logic replaces emotion. |
| Execution | You act on confirmation, not impulse. | Discipline replaces randomness. |
| Reflection | You review trade outcomes and journal behavior. | Growth replaces frustration. |
By repeating this loop dozens of times, you begin anticipating the market like you’ve a language. Each repetition strengthens how you trade the price action with conviction.
3. Price Action and Risk Management — The Unbreakable Pair
Despite the best setups, things often go wrong. Profitable long-term investments do not depend on prediction – they depend on risk management.
Price-action traders know their invalidation points before they enter a trade.
For example:
If price breaks the structure level that defined your setup, you exit.
No hesitation, no “let’s wait and see.”
This is why price action pairs so beautifully with copy trading platforms like Propxem — the logic behind entries and exits can be replicated with transparency and automation.
4. How to Build Your Own Market Bias (Without Indicators)
The key to developing a bias is not to guess where liquidity will go – it is to understand where it will likely go in the future.
Here’s a simple 3-step logic model:
- Define Context:
Are you in an uptrend, downtrend, or range?
(Check higher timeframes.) - Find Key Zones:
Where did price last react strongly?
(That’s where institutions left footprints.) - Wait for Confirmation:
Does the candle structure confirm continuation or reversal?
(React, don’t predict.)
Example: In the case of Gold (XAU/USD), price rejects the same support three times with long lower wicks. A rejection signals institutional absorption, which is a sign of an upward movement. You don’t need to use RSI or MACD to see that; the price already tells you.
5. Why Simplicity Wins in the Long Game
Research summarized by FXStreet and DailyFX educational desks suggests that traders using fewer indicators and focusing on naked chart behavior tend to achieve higher accuracy rates over time – not because they predict better, but because they make fewer emotional mistakes.
Losing trades aren’t eliminated by price action – they are eliminated by confusion.
In most cases, it is confusion, not loss, that destroys a trading account.
Those who trade the price action simplify decisions and avoid analysis paralysis.
Key Takeaways:
- Trading is 80% behavior, 20% strategy.
- Price action simplifies your decision-making framework.
- Risk control and clarity are the only true edges in any market.
- Journaling your trades builds intuition faster than any course.
Propxem Integration Tip:
On Propxem, users can follow traders who automatically apply these behavioral and structural principles. It provides beginners with the opportunity to learn the logic while benefiting from the experience of experienced traders.
Common Mistakes in Price Action Trading & How to Avoid Them
Often, price action trading is praised for its simplicity – clean charts, no indicators, and pure decision-making.
Yet here’s the paradox: because it appears simple, most traders oversimplify it, and that’s where the damage is done.
The key to trade the price action profitably is to know what to look for and what to avoid.
The following are some of the most common pitfalls price action traders fall into, and how professionals avoid them.
1. Confusing Noise with Structure
Random market movement is often mistaken for a “signal.”
Every candle on a 5-minute chart tells a story, but most of those stories are just noise.
A real structure is formed when price consistently reacts to certain levels (e.g., a zone that rejects price three or more times).
Example:
On EUR/USD, a trader sees a small pin bar and enters long immediately. Price rises by 10 pips, then collapses by 50 pips.
What’s the mistake? Acting on a single candle rather than a tested structure.
Avoid It By:
- Waiting for context confirmation — does the pin bar form at a key level or after exhaustion?
- Marking levels from higher timeframes (H4, Daily) before analyzing lower ones.
Key Takeaway:
Price action works only when you filter chaos into structure — not when you react to every wiggle.
2. Trading Without Confluence
There is a common misconception among beginners that one signal (such as a pin bar or an engulfing candle) equals a trading setup.
The reality is that professionals use confluence to predict moves: multiple factors that are in agreement.
Confluence Example:
- Bullish engulfing candle
- At retested support level
- Aligned with overall uptrend
- RSI divergence (optional, if used visually)
That’s not “more indicators” — it’s multi-angle confirmation.
Avoid It By:
- Building a checklist: “Structure → Candle → Confirmation.”
- Taking trades only when at least two technical factors align.
Key Takeaway:
The market rewards layered logic, not single-candle impulse.
3. Ignoring the Higher Timeframe Story
In spite of their expertise, intraday traders fail due to their overzealous zooming in.
You gain more accuracy by trading in the direction of higher timeframe structures.
Example:
A trader shorts on M15 after a small bearish pin bar, but the daily chart shows a strong uptrend retesting major support.
The “perfect” setup fails because it went against market context.
Avoid It By:
- Doing a top-down analysis:
- Identify the dominant trend on the Daily chart.
- Confirm structure zones on H4.
- Enter only when M15/M30 aligns.
Key Takeaway:
Every candle is part of a bigger story — don’t trade the sentence, trade the chapter.
4. Overtrading and Emotional Triggers
Trading price action feels intuitive, so traders often take too many trades in a session – every small pattern feels right.
Even strong setups can be destroyed by overtrading due to decision fatigue and emotional bias.
Researchers from FXCM found that traders who took fewer than five trades per week had nearly 40% higher profitability than those who took more than twenty.
Avoid It By:
- Limiting yourself to 2–3 A+ setups per week.
- Reviewing your journal before each session to reinforce discipline.
- Using alerts instead of staring at charts for hours.
Key Takeaway:
Fewer, higher-quality trades outperform constant screen-chasing — in profits and in peace of mind.
5. Misinterpreting Candlestick Patterns in Isolation
In a downtrend, an engulfing bullish candle is not a “reversal.”
Validity is determined by context, not by pattern names.
Example:
If an engulfing candle forms during consolidation, it means nothing.
However, if it forms after three consecutive pushes into daily support, it is significant.
Avoid It By:
- Studying location before formation.
- Looking for signs of exhaustion (e.g., shrinking candles, wicks, slowing momentum).
Key Takeaway:
The same pattern can mean continuation or reversal — only structure decides which.
6. Lack of Trade Journal and Review
The majority of traders do not record their trades. It’s like playing chess without remembering your last move.
Journaling reveals your blind spots – maybe you buy into resistance or close early before your targets.
Avoid It By:
- Keeping a spreadsheet with:
- Date & pair
- Entry/exit reasons
- Screenshot of the setup
- Emotion rating (1–5)
- Reviewing every 20 trades to find patterns of error.
Key Takeaway:
Journaling transforms “experience” into “evidence.” Professionals improve because they measure, not because they trade more.
7. Ignoring Market Sentiment and News Context
The fundamental catalyst is respected even by price action traders.
In the case of a breakout right before a central bank announcement, ignoring economic events can invalidate even a perfect setup.
Avoid It By:
- Checking the economic calendar (ForexFactory, Investing.com).
- Avoiding trades 15–30 minutes before high-impact events (NFP, CPI, Fed speeches).
Key Takeaway:
Listen to the chart — and always trade the price action, not your emotions.
Price Action Mistakes & Fixes
| Mistake | What Happens | Smart Fix |
| Trading random candles | False signals & losses | Wait for structured levels |
| No confluence | Unreliable setups | Combine structure + candle + confirmation |
| Ignoring higher timeframe | Counter-trend losses | Use top-down alignment |
| Overtrading | Emotional burnout | Trade 2–3 A+ setups weekly |
| Blind candle reading | Context errors | Study location, not shape |
| No journal | Repeating mistakes | Track and review trades |
| Ignoring news | Unexpected reversals | Check economic calendar |
Propxem’s professional traders use the same price action principles behind every automated trade – structured levels, trend context, and disciplined execution.
You are basically replicating human-tested price action systems without the emotional stress when you copy trades via our platform.
Key Takeaway:
- Trade context, not emotion.
- Build confluence, not clutter.
- Align timeframes, respect fundamentals.
- Log, review, and refine your execution.
By focusing on structure, confluence, and discipline, you can continuously refine your ability to trade the price action with confidence.
The price is always talking — success depends on how patiently you listen.
